Control Flow Graph Tool
A control flow graph is a representation of a program where contiguous regions of code without branches, known as basic blocks, are represented as nodes in a graph and edges between nodes indicate the possible flow of the program. Avrora includes a tool to generate a control flow graph for AVR programs, which can shed light on the structure and organization of machine code programs.The control flow graph tool can be invoked with the -action=cfg option to Avrora. It can generate output in one of two formats: a text-based straight-line representation of each basic block with successors listed at the end of the code for each block, and as a textual format supported by the dot graph rendering tool that is freely available. These two output formats can be selected with the -output option.
An Example Program
Suppose that you are interested in building the control flow graph for some program that you are working on. How can this be done? Consider the following example program:
;-------------------------------------------------------------- ; example.asm: Example program for control flow graph utility ;-------------------------------------------------------------- start: jmp begin ; entrypoint of program .org 0x80 ; skip interrupt table bad_interrupt: reti begin: ; begin main program call wait ; wait before we get started ldi r17, 1 ldi r18, 2 ldi r19, 1 ldi r20, 10 loop: ; beginning of fibonacci loop mov r21, r17 add r21, r18 mov r17, r18 mov r18, r21 inc r19 ; increment trip count cpi r19, 10 breq again ; do it again? jmp loop again: call wait ; wait for a little bit call wait ; wait again jmp begin ; do it again wait: ldi r16, 1 inc r16 cpi r16, 0 brne wait ret |
Getting a Textual Control Flow Graph
Avrora can generate the control flow graph in either a colored textual representation or a style suitable for graph rendering tools. To create a textual graph, the -action option to Avrora can be used in the following way.
Rendering a Control Flow Graph with "dot"
A textual control flow graph becomes less useful as the size and complexity of the program increases. For larger graphs, it becomes increasingly difficult to understand the big picture. Therefore, Avrora can generate a control flow graph of the program in a format suitable for loading with the dot graph rendering tool. The follow example illustrates the process.
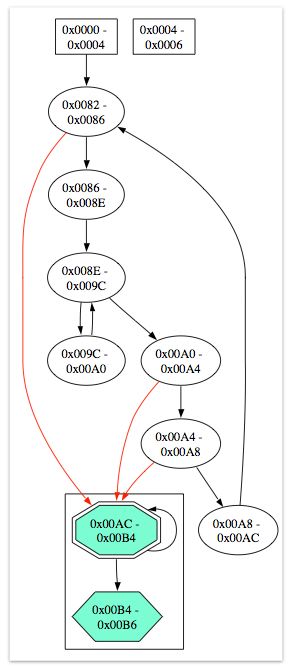
After rendering with dot, the finished product will look like this:

Each node represents a basic block of instructions. The square nodes are places that can be entered from an interrupt (i.e. the interrupt handler table). Double octagon nodes are the entrypoints of procedures. Hexagonal nodes are basic blocks that end with a return or return-from-interrupt instruction. Normal edges correspond to normal control flow such as jumps, branches, and fall-throughs. Red edges correspond to call edges. Dotted edges correspond to indirect calls or jumps within the program.
By default, the control flow graph utility attempts to use the call instructions to determine the entrypoints into procedures and then tries to group basic blocks into procedures and then color them. This functionality can be adjusted with the options available to the control flow graph utility. For more information on the cfg action, see the online help.
